 [Illustration by Phil Saunders / spacechannel.org]
Hyperspectral imaging (HSI) is a technique combining imaging and spectroscopy to survey a scene and extract detailed information. Also called imaging spectroscopy, HSI is a powerful, data-processing-intensive method that creates a “data cube” containing information about the properties of a target at hundreds to thousands of narrow wavelength bands within the system’s field of view. Scientists can cross-check the obtained spectra with known, unique spectral fingerprints to detect, characterize and identify chemical compositions, materials, liquids, activities or events, which can then be referenced to a precise location in a scene.
Originally designed for top-secret military satellites and surveillance in the 1980s, hyperspectral technology has been limited by its high cost and the difficulty of processing the huge amounts of data it produces. But recent computing advances and improvements in data acquisition and analysis have extended HSI’s benefits to countless applications, from astronomy to weather forecasting. And many of these new applications—such as food inspection, pathogen detection, airport security, law enforcement and oil and gas pipeline inspection—are all about security and safety.
In addition to computing and data-processing advances, volume fabrication techniques are pushing down the size and cost of sensors and detectors—and, thus, the overall cost of the HSI systems that rely on them. A February 2015 report from the analysis firm MicroMarket Monitor (Dallas, Tex., USA) predicts that the nascent global market for hyperspectral imaging will grow at a compound annual rate of 12 percent from 2014 to 2019. Driving that expansion, according to the report, will be a shift toward inexpensive, compact systems that can process large datasets at high speed.
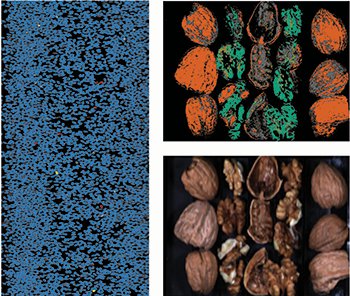 HSI in food processing: An HSI system can highlight defective nuts on a conveyor belt full of almonds (left), and can distinguish between unshelled nuts, shelled nuts, and hulls in a group of walnuts (top right)—something not as clear in a true-color image of the same nuts (bottom right). [Resonon Inc.]
This has made HSI systems more affordable and has prompted a surge in new commercial applications, including agricultural monitoring, precise medical diagnostics, environmental surveillance (like oil spill monitoring and pollutant dispersal), and other research projects in geology, marine science and forestry. “HSI has been one of the fastest-growing technologies in electro-optics in the 21st century,” says Peter Yuen, a researcher at Cranfield University (Swindon, U.K.).
Food safety
HSI has grown in industrial applications like food safety in recent years. The advent of cost-effective fabrication has enabled compact, lightweight and less-expensive HSI systems in commercial machine-vision applications like food sorting and pharmaceutical quality control. Such applications require the ability to “see” targets in a scene and ignore undesired foreground and background information. It’s a task that humans are good at; the goal of machine vision is to match human cognitive ability and conserve the need for human labor, thereby saving cost in the long term.
HSI machine-vision technology can do more than humans, faster, and it can see far beyond the visible region, where humans cannot. One HSI system manufacturer with recent success in this area is Resonon (Bozeman, Mont., USA). Resonon specializes in hyperspectral cameras combined with partnering robotic machine-vision systems that can identify and sort objects—such as edible nuts coming down a conveyor belt—faster than humans.
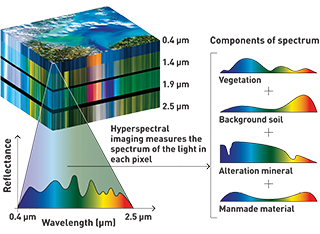 The science behind hyperspectral imaging
Hyperspectral imaging (HSI) produces a data cube of 100 or more narrow spectral bands at each pixel, in an instantaneous field of view. The number of pixels varies depending on the sensor of the instrument. A typical HSI system samples the light (commonly reflectance) from a scene, passes it through a slit, disperses it spectrally with a grating or prism and focuses it on a detector or sensor. For each pixel or raster cell position, the system obtains and plots a brightness value at each wavelength to create a continuous spectrum for the image cell.
Scientists can compare these high-resolution spectra over the entire wavelength region with standard library spectra to identify, for example, concrete versus granite, healthy versus diseased crops, healthy versus cancerous lesions, and even whether a person’s skin is flushed from stress or not. “If a picture is worth a thousand words, a hyperspectral image is worth almost 1,000 pictures,” noted John Ferguson, retired managing director at Photonics and Analytical Marketing Ltd. in Leeds, U.K., in an online tutorial presentation.
HSI systems can collect spectral and spatial information from ultraviolet to longwave IR (LWIR) wavelengths, and can detect light from reflectance, fluorescence, emission, or transmission, depending on the application. The spectra of interest for reflective applications of HSI, like identifying vegetation or detecting camouflage, can range from blue visible light at 400 nm to the near infrared (NIR) at 1,100 nm. For emissive hyperspectral applications, like identifying explosions or targets at night, the region from shortwave infrared (SWIR) at 11 µm to LWIR at 14 µm is useful.
Hyperspectral imaging differs from a related technique, multispectral imaging, primarily in the number of wavelength bands and how narrow they are. The multispectral technique typically produces 2-D images of a few to a hundred wavelength bands, each covering tens of nanometers. In contrast, hyperspectral imaging obtains a large 3-D cube of a hundred or even thousands of images, with dimensions (x, y, λ), each representing only a few nanometers in range. Multispectral imaging is faster and easier to process with its smaller data set, while hyperspectral imaging provides much greater complexity of data, higher resolution spectra, and is more versatile, with numerous emerging applications beyond satellite-based imaging.
The Pika II hyperspectral camera is a pushbroom line scanner that covers 240 wavelengths, from the UV at 400 nm to the IR at 900 nm, with a spectral resolution of 2.1 nm. With 640 spatial channels and a maximum frame rate of 145 frames per second (fps), the camera and real-time statistical pattern recognition software tell the robotic pick-and-sort system which hulls and detritus to remove from a conveyor belt full of nuts based on their unique spectral signatures.
In the case of almonds, the system can distinguish “good” brown almond nuts from brown almond hulls, which a standard three-color camera system cannot. The system rejects foreign materials, chipped nuts, shells and anything else that doesn’t belong in the food stream in real time, faster than manual inspectors or traditional machine-vision systems. The Resonon camera, partnered with automated sorting solutions from Bratney Companies (Des Moines, Iowa, USA) and FANUC Robotics (Rochester Mills, Mich., USA), can identify and sort up to 220 culls per minute.
“Hyperspectral imaging produces enormous datasets,” says Adam Stern, senior scientist at Resonon. “Each picture has a million pixels, and each pixel has 240 12-bit data points. Modern computers are finally able to handle the processing and keep it economically feasible.”
Indium gallium selenide (InGaS) sensors extending into the NIR-SWIR range, from 900 to 1,700 nm and beyond, would provide a great deal more information, according to Stern, but the cost of such systems often ranges to US$50,000 or more. The next step in commercial machine vision will be to make that spectral range affordable.
Detecting dangerous microbes
Building on past success using HSI systems to detect fecal matter and E. coli bacteria in the food supply, the U.S. Department of Agriculture is conducting research in the use of hyperspectral microscope imaging (HMI) to track foodborne disease outbreaks. Agricultural engineer Bosoon Park and colleagues at the USDA’s Agricultural Research Service in Athens, Ga., USA, experimented with imaging five different Salmonella serotypes at different incubation times using an HMI system based on an acousto-optical tunable filter (AOTF) from Gooch & Housego (Ilminster, U.K.).
The AOTF HSI-400 enables flexible, fast tuning of selected passbands of wavelengths at programmable bandwidths, which is not possible with a dispersive spectrograph system. The AOTF therefore eliminates the need to scan the system past the target or vice versa. An AOTF system passes an acoustic wave simultaneously with the incident light through a piezoelectric telllurium dioxide (TeO2) crystal, which behaves like a grating to diffract the light into the sensor.
The experiment allowed Park and his team to conclude that HMI can detect Salmonella and other bacteria on the cellular level earlier than previously thought—after only 8 hours of incubation rather than 24.
“We can implement HMI on the cellular level as a rapid and early tool for presumptive detection of several bacterial pathogens,” said Park. “Future work will focus on fewer wavelengths, to reduce the required data storage and processing time, which is necessary to implement this technology in the food industry.”
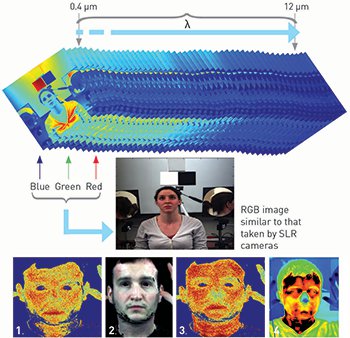 (Top) HSI for stress detection: The HSI technique used by Yuen’s team uses an acousto-optical cell and scanning mirror to sweep the image across the frequency dimension in 2-nm steps, in contrast to an RGB image, which captures three broad bands of red, green and blue. (Bottom) 1. Baseline StO2 blood oxygenation imaged in the VNIR using an AOTF system, 2. After stress in RGB image, 3. After stress in the VNIR, 4. After stress at thermal wavelengths. [K. Hong and P. Yuen, Cranfield University]
Stress detection
In another application with interesting implications, an international team of researchers led by Peter Yuen at Cranfield University has applied HSI to the detection of emotional stress signals to identify potential criminals. Stress causes a variation in blood oxygenation in exposed areas of the body, such as in the face and hands. This blood oxygenation level is invisible to the eye—but it can’t hide from HSI.
The non-contact technique involves the use of a very-near IR (VNIR) spectrograph from Headwall Photonics (Fitchburg, Mass., USA) along with a camera operating at a wavelength range from 400 to 1,000 nm and a thermal mid-wave IR (MWIR) camera (a FLIR SC7600) to measure tissue oxygen saturation (StO2) as a physiological indication of stress.
As the subjects were subjected to situations (such as public speaking and mental arithmetic) used in standard psychological studies to elicit acute stress, the HSI system placed two to three meters away took 10 seconds to record one data cube of 300 wavelengths. All 85 participants exhibited increased StO2 levels, particularly in the forehead region. The detection of stress using HSI was correlated with thermal imaging data, as skin temperature is another variable used as a stress indicator.
HSI sampling: Four techniques
 In spatial scanning, or “pushbroom” imaging, the system sweeps a slit aperture and grating across the spectral range in a single swath or line (x, λ) across a target area repeatedly over time, as the target passes in the y dimension (for example, on a conveyor belt application or from a satellite sweeping over an image area). The individual (x, λ) linescans are then combined in the y dimension into a hyperspectral data cube. A pushbroom system might also have a scanning mirror in front of the camera to capture the different lines of the target.
 Snapshot or non-scanning imaging simultaneously captures both spectral and spatial information in a single image (x, y, λ) over a single integration time—using, for example, a large-format detector array capturing different wavelengths. No scanning is involved, so motion artifacts are eliminated and data processing simplified. That makes the technique ideal for low-resolution video rates, low-light imaging or high-speed applications.
 Spatio-spectral scanning acquires a series of thin diagonal (x, y) slices of the data cube, each at every wavelength in the series. Typically, the system or camera must be scanned transverse to the slit. The dispersion-based system yields high spectral and spatial resolution, which is useful in astronomical imaging.
 Spectral or “staring” scanning images a static or stationary scene in the (x, y) dimensions, while obtaining the λ dimension via the use of a tunable filter or stepping through a series of different pass-band filters over time. Spectral smearing can occur if the target area has movement, but it’s useful for applications like samples under a microscope.
Yuen believes that his team’s HSI technique can effectively distinguish would-be terrorist suspects or extremely mentally stressed individuals in airports from people with ordinary levels of stress. It could also complement other indicators of stress, such as temperature (for which the stress signature can vary depending on ambient temperature) and perspiration (which may not indicate psychological stress in some situations, such as that of an individual sweating after running to catch a plane).
“We are only just beginning to research these ways of applying hyperspectral imaging for surveillance and law enforcement,” said Yuen. “It will take more research to improve its discrimination rate, and eventually, we would have to figure out how to use it without violating privacy laws.”
Hyperspectral in motion
The development of HSI at video rates over the past decade presents altogether new problems in data storage and data processing rates. How can so much information be useful if an HSI video produces a massive data cube for every frame? Researchers are working with industry partners to discover new ways to use and analyze HSI video for numerous applications.
Researchers at Bodkin Design & Engineering (Newton, Mass., USA), the University of Wisconsin-Madison (USA), Norton Engineering Optics (Palo Alto, Calif., USA) and Space Computer Corporation (Los Angeles, Calif., USA) have collaborated on an HSI system that works in both snapshot and staring mode, along with a unique optical processor that provides video-rate hyperspectral data cubes. Pinholes create parallel optical paths in the system to fashion a full (x, y, λ) data cube for each video frame.
The design re-images individual scene elements in parallel through a prism onto a focal plane array. The elements are read via a frame grabber and stored on a PC, where “cube formation software” converts the recorded spectra into a 3-D data cube in a format easily processed by standard image software. The software processes one data cube every two seconds, which can lead to a backlog at video rates of 15 fps, but it can continue processing as additional video is acquired.
The experiment tested numerous hyperspectral systems from visible through LWIR. Two systems from Bodkin were tested in Boston. In one result, a boat on Boston Harbor was tracked by its spectral signature, which could be used to positively identify the same boat if acquired again later. In another result, the team was able to determine the spectrum of any point in the hyperspectral video—which enabled highlighting of, for example, magnolia blossoms from a block away. A similar technique with a thermal MWIR HSI could also be useful for identifying explosive ingredients like potassium nitrate and ammonium nitrate residue on surfaces.
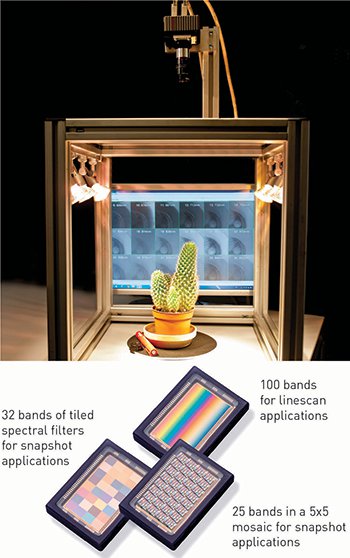 HSI for video: (Top) A prototype hyperspectral camera for real-time video and snapshot applications delivers test data within a few days. (Bottom) A new set of hyperspectral image sensors for snapshot applications. [IMEC]
The design results in a low-cost, small-form-factor device with no motion artifacts; data rates are reduced enough for reasonable processing time as the video is acquired. The disadvantage is that high spatial resolution comes at the cost of low spectral resolution and vice versa.
Microsize me
Hyperspectral sensor designer IMEC (Leuven, Belgium) announced in January a set of new snapshot HSI sensor designs that enable video data rates of 340 fps. In addition to enabling fast machine vision, the sensors are built for extremely compact but high-volume applications like precision agriculture via unmanned aerial vehicle (UAV), security and medical imaging.
The new CMOS image sensors are mass produced to lower their cost, and are available in 4×4 and 5×5 arrays. One new design features mosaic filters with one filter per pixel. The 4×4 sensor features 16 spectral bands between 470 and 630 nm of the visible range. The 5×5 provides 25 bands between 600 and 1,000 nm of the visible-IR range. Another HSI snapshot sensor for line-scanning applications places a Fabry-Pérot wedge filter over a CMOS imager to transmit 100 narrow bands at 5-nm resolution from 470 to 900 nm.
“When partnered with the right camera for the application, these new mosaic sensors are ideal for industrial applications with or without linescan capability,” said Andy Lambrechts, program manager at IMEC. “The compact sensors can even be scaled to handheld devices, and the spectral range now reaches down to 470 nm.” HSI system designers may find new applications for such sensors, and be able to develop custom, proprietary solutions that optimize (depending on their requirements) for speed, compactness, spatial versus spectral resolution and band selection.
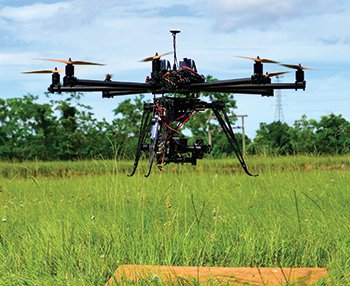 HSI in UAVs: Compact HSI systems can be carried in drones for aerial surveillance and precision agriculture. [Global UAI]
Another company in the news for ultra-compact HSI systems is BaySpec (San Jose, Calif., USA). In October 2014, the company announced the “world’s smallest UAV-optimized hyperspectral imager,” designed for use in airborne precision agriculture, remote sensing, law enforcement, and security and defense, among other areas. The OCI-UAV imager can move while on the UAV to scan at the desired rate and acquire continuous visible-to-NIR hyperspectral data. The camera head measures 8×6×6 cm and weighs 0.4 lb (180 g). The computer can capture frame rates of 120 fps.
The trend toward ultracompact HSI is timely, as the U.S. Federal Aviation Administration (FAA) ruled in April that commercial drone operators can apply for exemptions from FAA regulations to operate UAVs in safety applications, such as inspections of power lines, pipelines, and oil and gas flare stacks. Other applications that can apply for the waiver include precision agriculture, filmmaking and real estate photography. Shortly after the announcement, Amazon received approval to fly drones in testing of new unmanned delivery methods. Hyperspectral imaging seems poised for takeoff.
Valerie C. Coffey is a freelance science and technology writer and editor roving the United States in a 45-foot motor coach with a mobile hotspot.
References and Resources
-
J. Gilchrist. “Hyperspectral imaging spectroscopy: A look at real-life applications,” in Photonics Handbook (Lauren Publishing, 2007).
-
W. Hungate et al. “History and description of hyperspectral imaging,” in Hyperspectral Remote Sensing: Principles and Applications, (Taylor and Francis, 2008).
-
D. Bannon and C. Van Veen. “Hyperspectral imaging gets stamp of approval for food processing,” Photonics Spectra, June 2012.
-
A. Bodkin et al. “Video-rate chemical identification and visualization with snapshot hyperspectral imaging,” Proc. SPIE 8374, Next-Generation Spectroscopic Technologies V, 83740C (2012).
-
J. Happich. “The future of video surveillance: HD, hyperspectral and stereoscopic,” EE Times Europe, 5 February 2014.
-
T. Chen et al. “Detection of psychological stress using a hyperspectral imaging technique,” IEEE Trans. Affec. Comp. 5, 391 (2014).
-
M. Eady et al. “Rapid and early detection of Salmonella serotypes with hyperspectral microscopy and multivariate data analysis,” J. Food Prot. 78, 668 (2015).
-
MicroMarket Monitor, “Hyperspectral Imaging Market by Application – Global Forecast to 2019,” February 2015.

